How to set up LLM analytics for Anthropic's Claude
Apr 09, 2024

Tracking your Claude usage, costs, and latency is crucial to understanding how your users are interacting with your AI and LLM powered features. In this tutorial, we show you how to monitor important metrics such as:
- Total cost per model
- Average cost per user
- Average API response time
We'll build a basic Next.js app, implement the Claude API, and capture these events using PostHog.
1. Create the demo app
To showcase how to track important metrics, we create a simple one-page Next.js app with the following:
- A form with textfield and button for user input.
- A label to show Claude's output.
- A dropdown to select different Anthropic models.
First, ensure Node.js is installed (version 18.0 or newer). Then run the following script to create a new Next.js app and install both the Anthropic JavaScript and PostHog Web SDKs:
When prompted, select No for TypeScript, Yes for use app router, No for Tailwind CSS and the defaults for every other option.
Next, we set up Posthog using our API key and host (You can find these in your project settings). Add the below code to app/providers.js:
Then we import the PHProvider component into app/layout.js and wrap our app with it:
Then replace the code in page.js with our basic layout and functionality. You can find your Anthropic API key here.
Lastly, replace the code in next.config.mjs with the following:
Our basic app is now set up. Run npm run dev to see it in app action.
2. Capture chat completion events
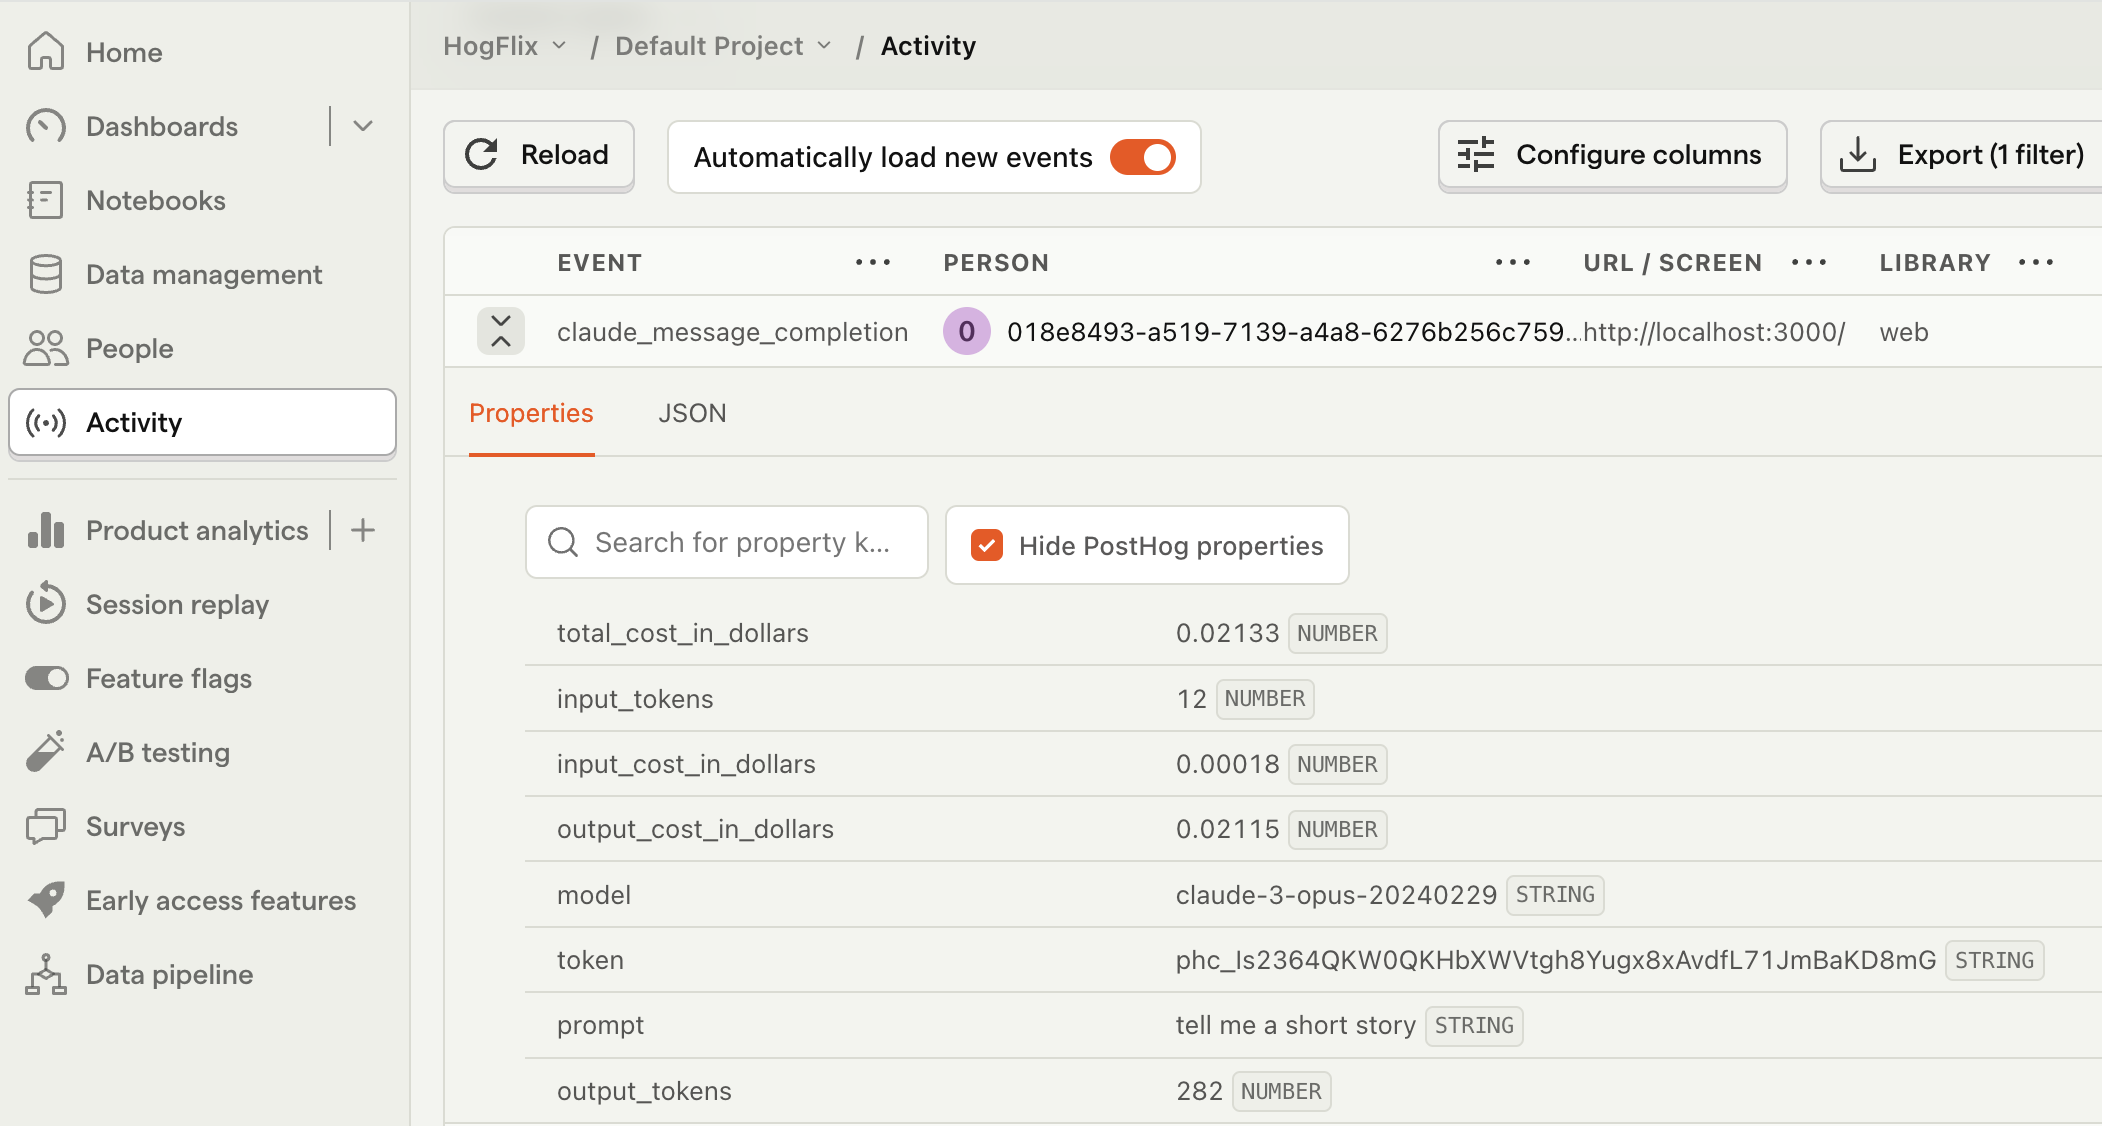
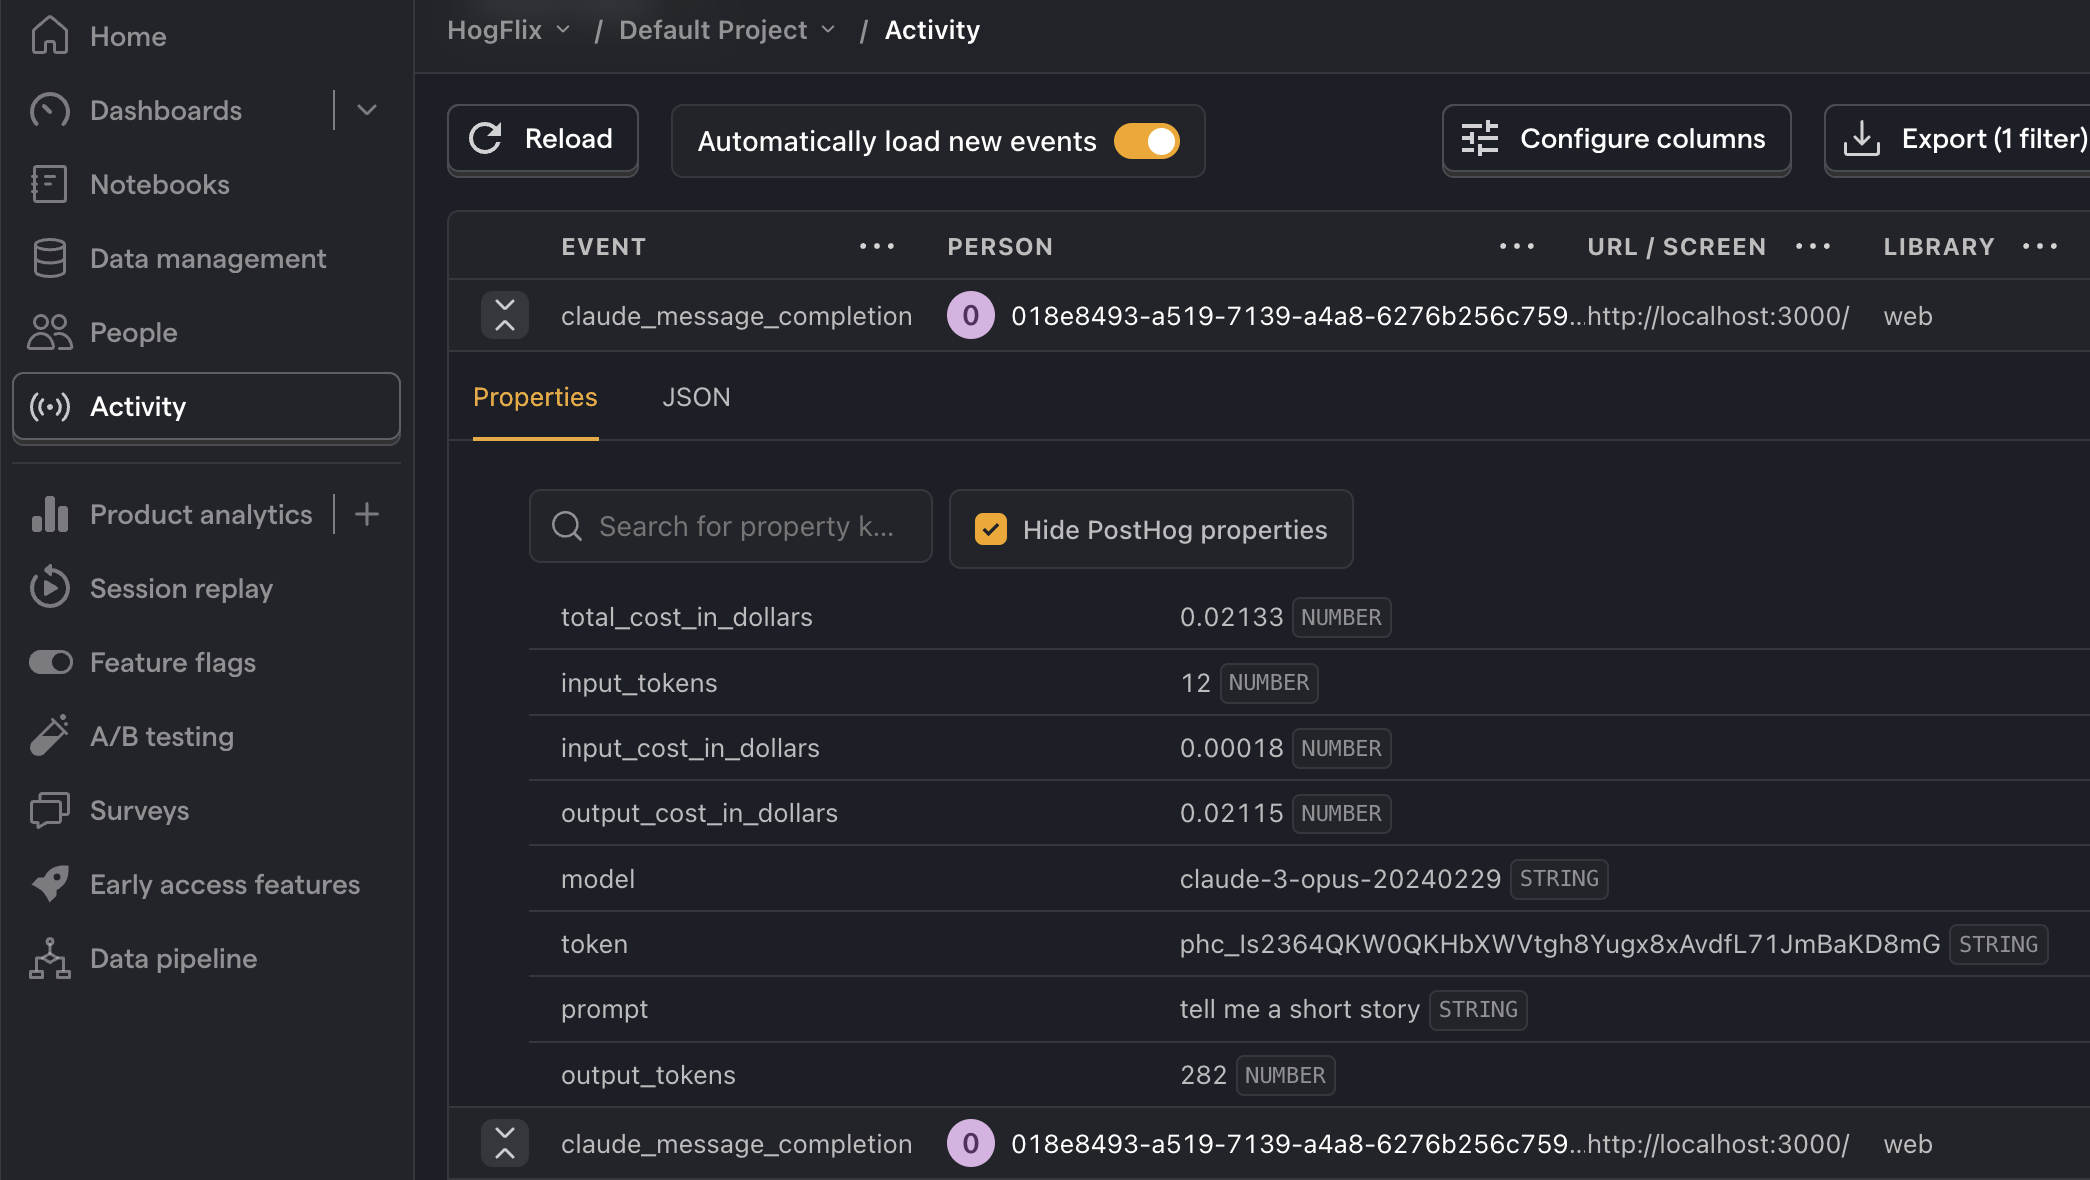
With our app set up, we can begin capturing events with PostHog. To start, we capture a claude_message_completion event with properties related to the API request. We find the following properties most useful to capture:
promptmodelinput_tokensoutput_tokensinput_cost_in_dollarsi.e.input_tokens*token_input_costoutput_cost_in_dollarsi.e.output_tokens*token_output_costtotal_cost_in_dollarsi.e.input_cost_in_dollars + output_cost_in_dollars
Update your fetchResponse() function in page.js to capture this event:
Refresh your app and submit a few prompts. You should then see your events captured in the PostHog activity tab.
3. Create insights
Now that we're capturing events, we can create insights. Below are three examples of useful metrics you should monitor:
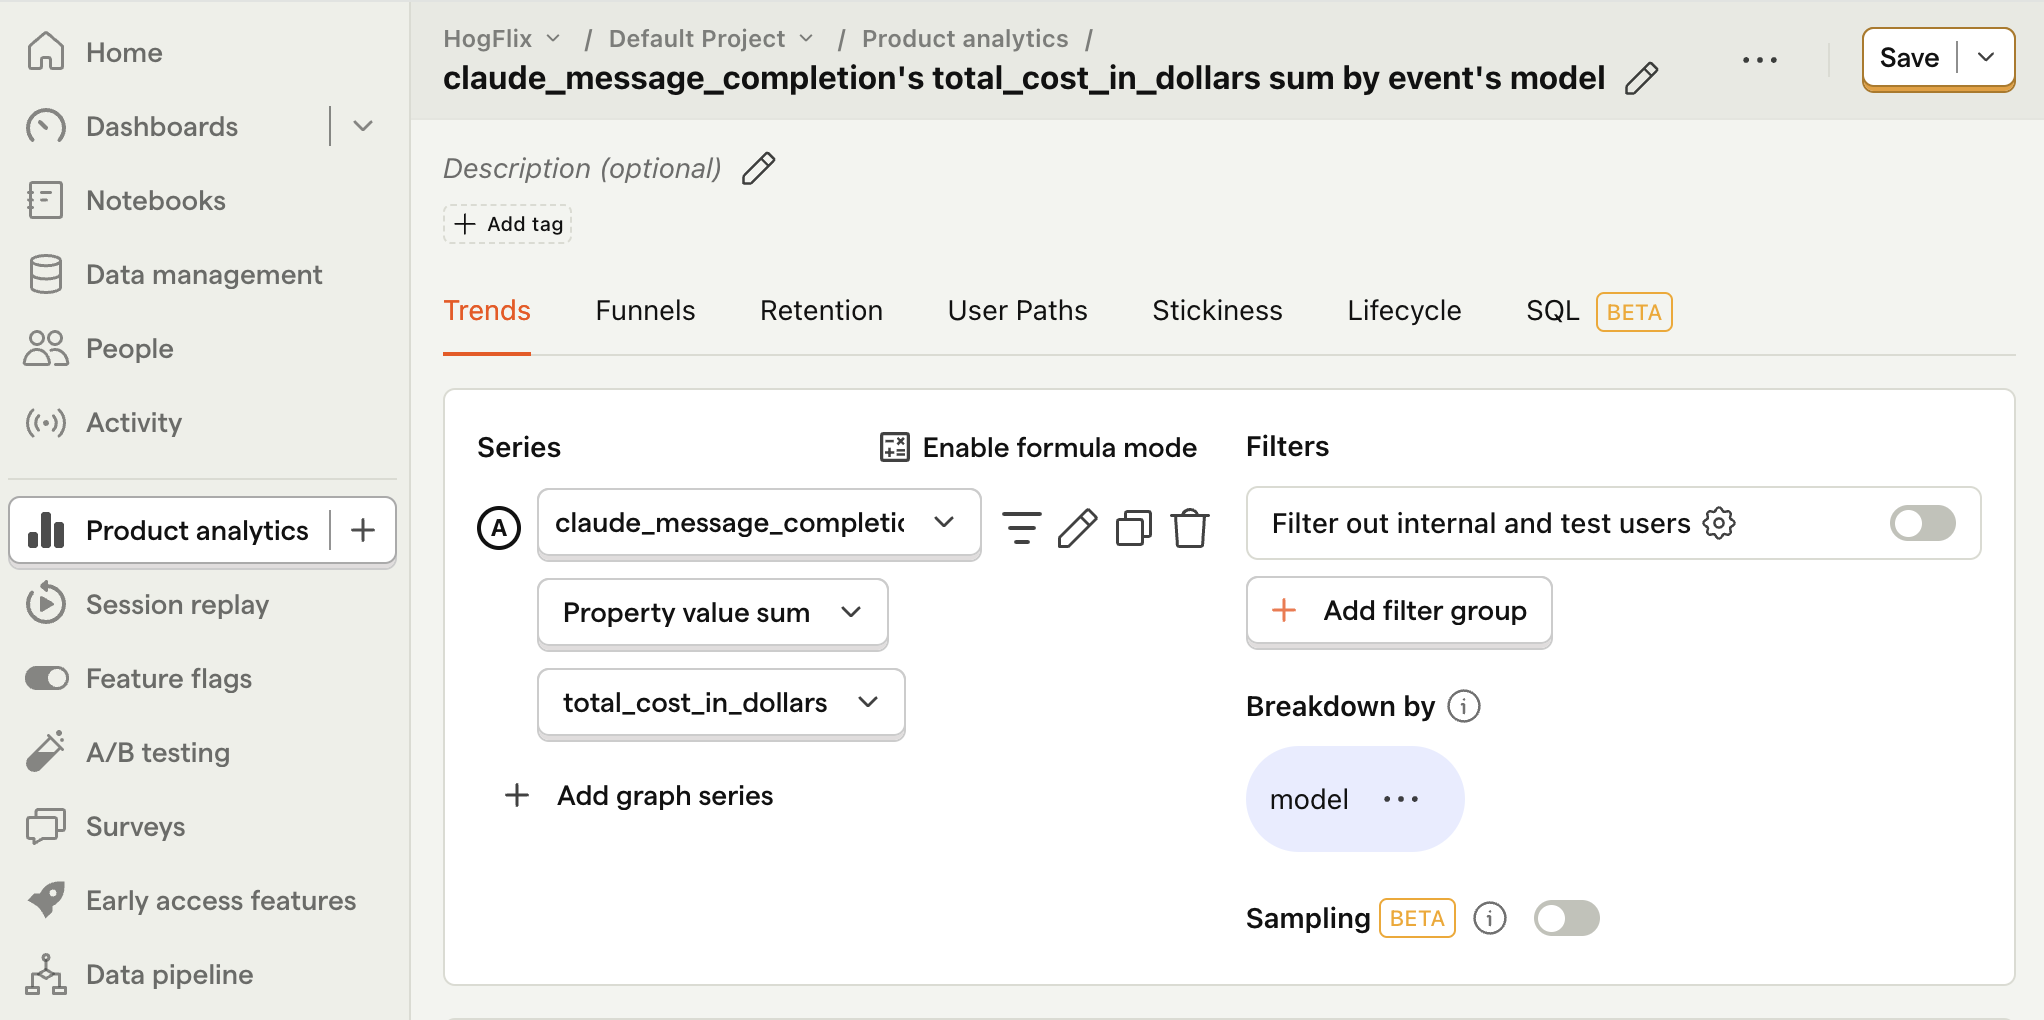
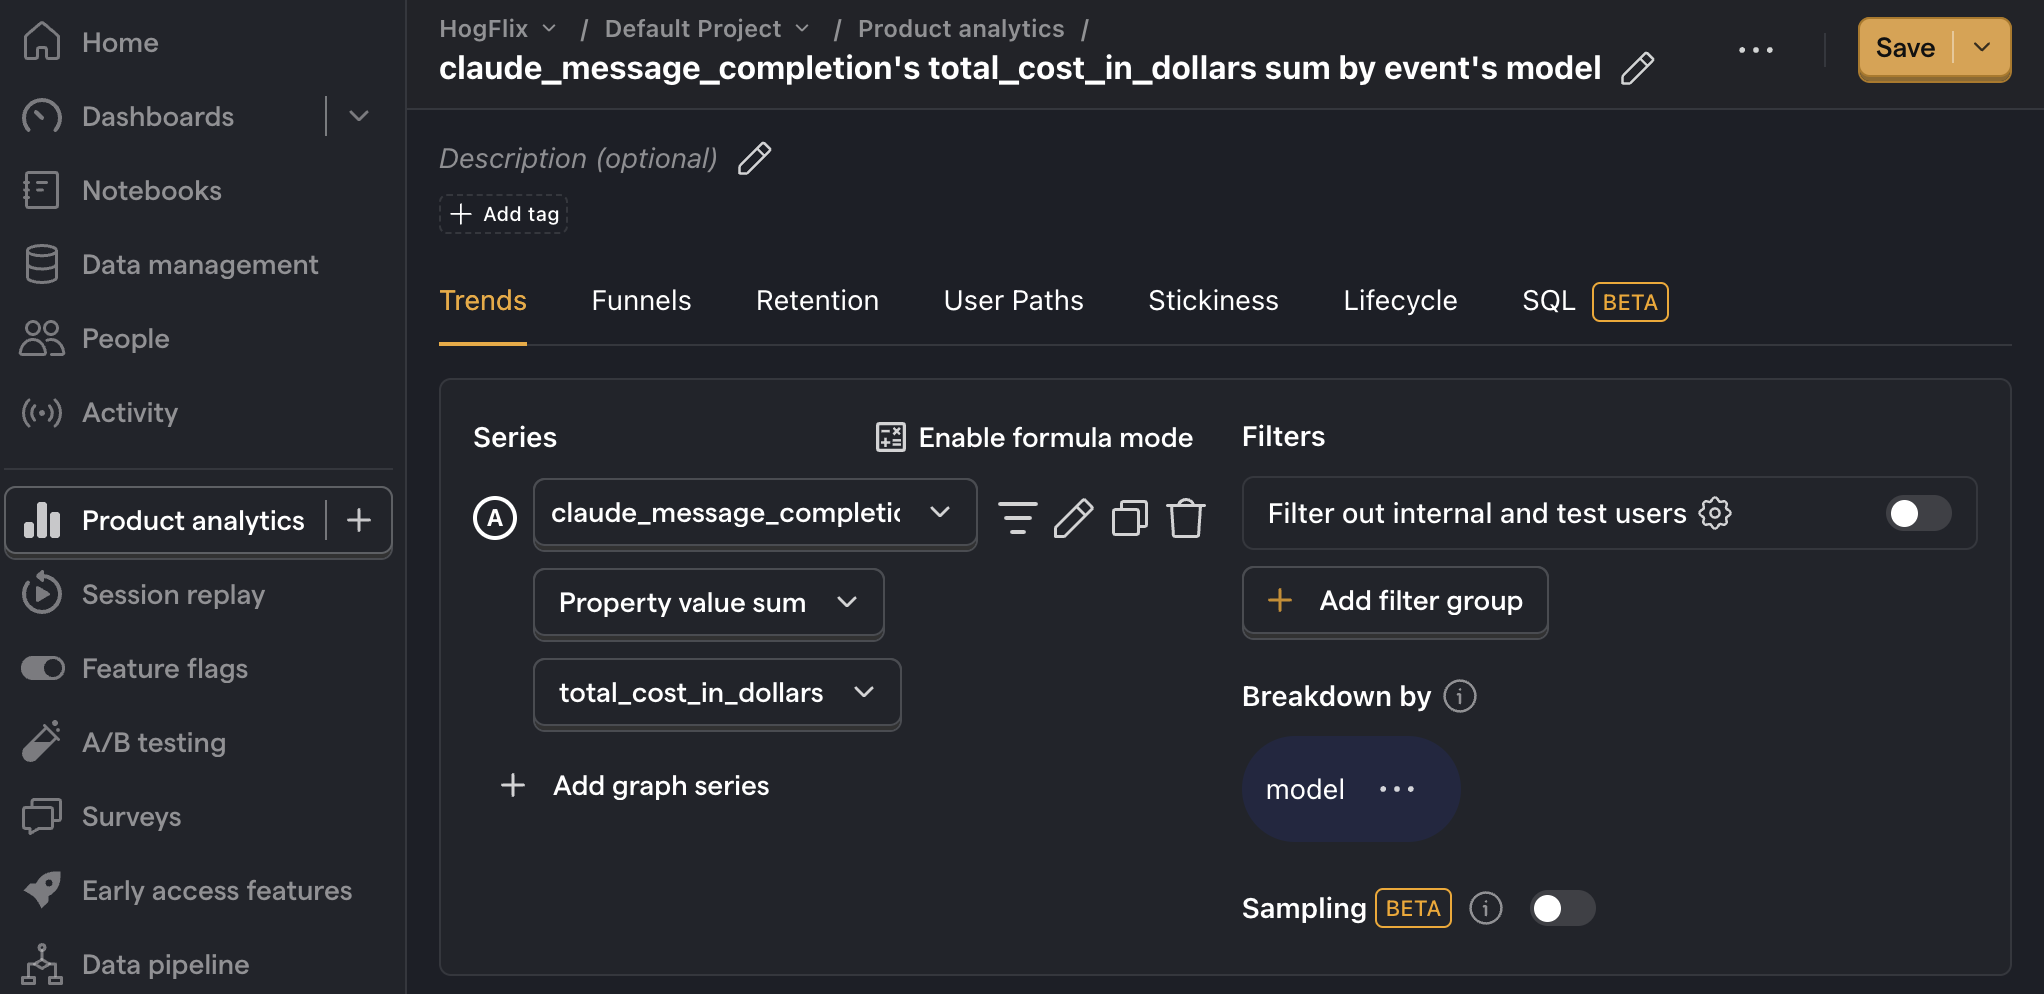
Total cost per model
To create this insight, go the Product analytics tab and click + New insight. Then:
- Set the event to
claude_message_completion - Click on Total count to show a dropdown. Click on Property value (sum).
- Select the
total_cost_in_dollarsproperty. - Click + Add breakdown and select
modelfrom the event properties list.
Note: Insights may show
0if the total cost is less than0.01.
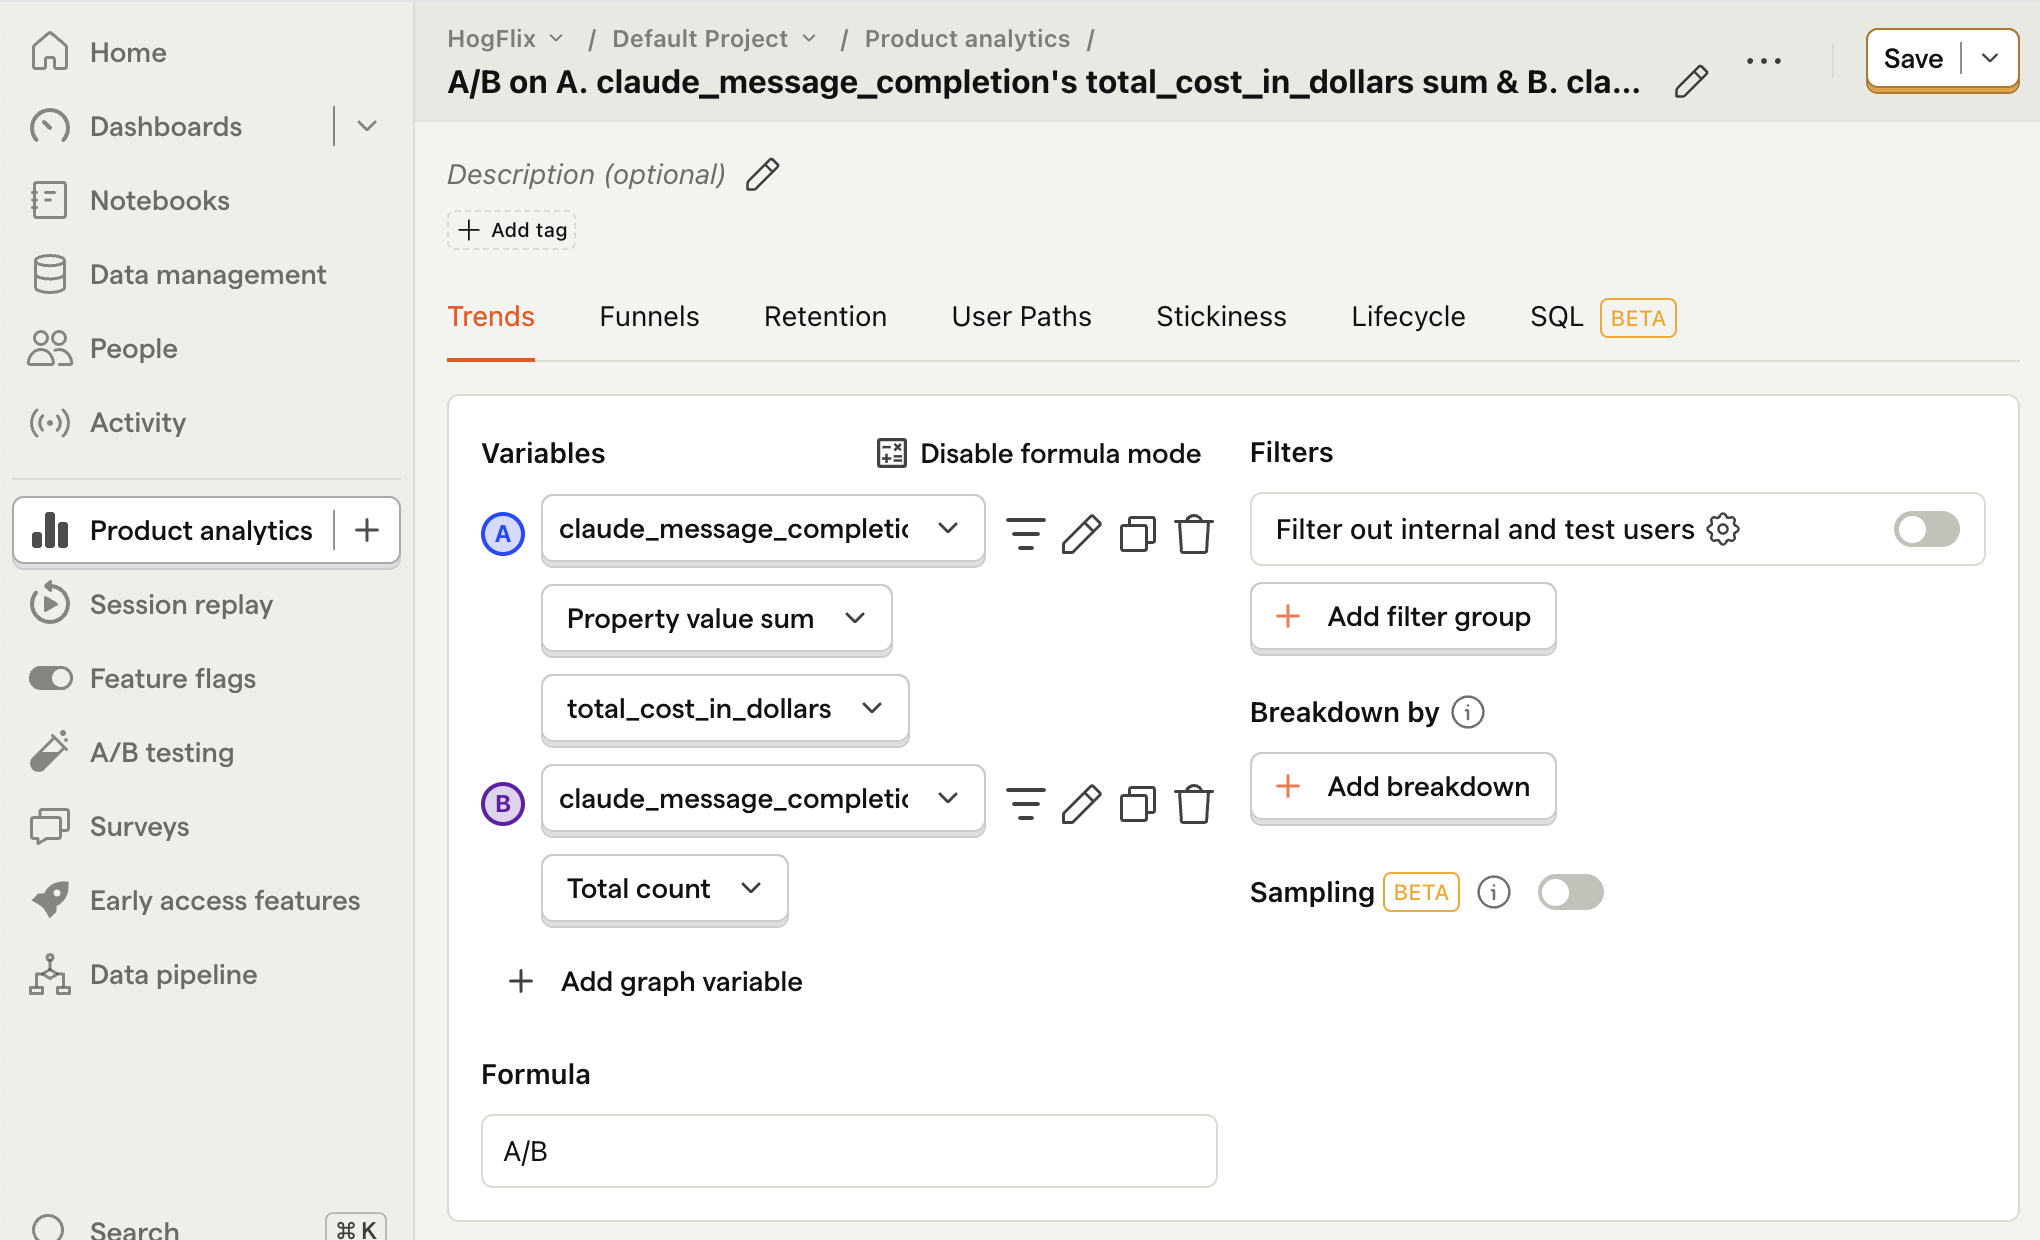
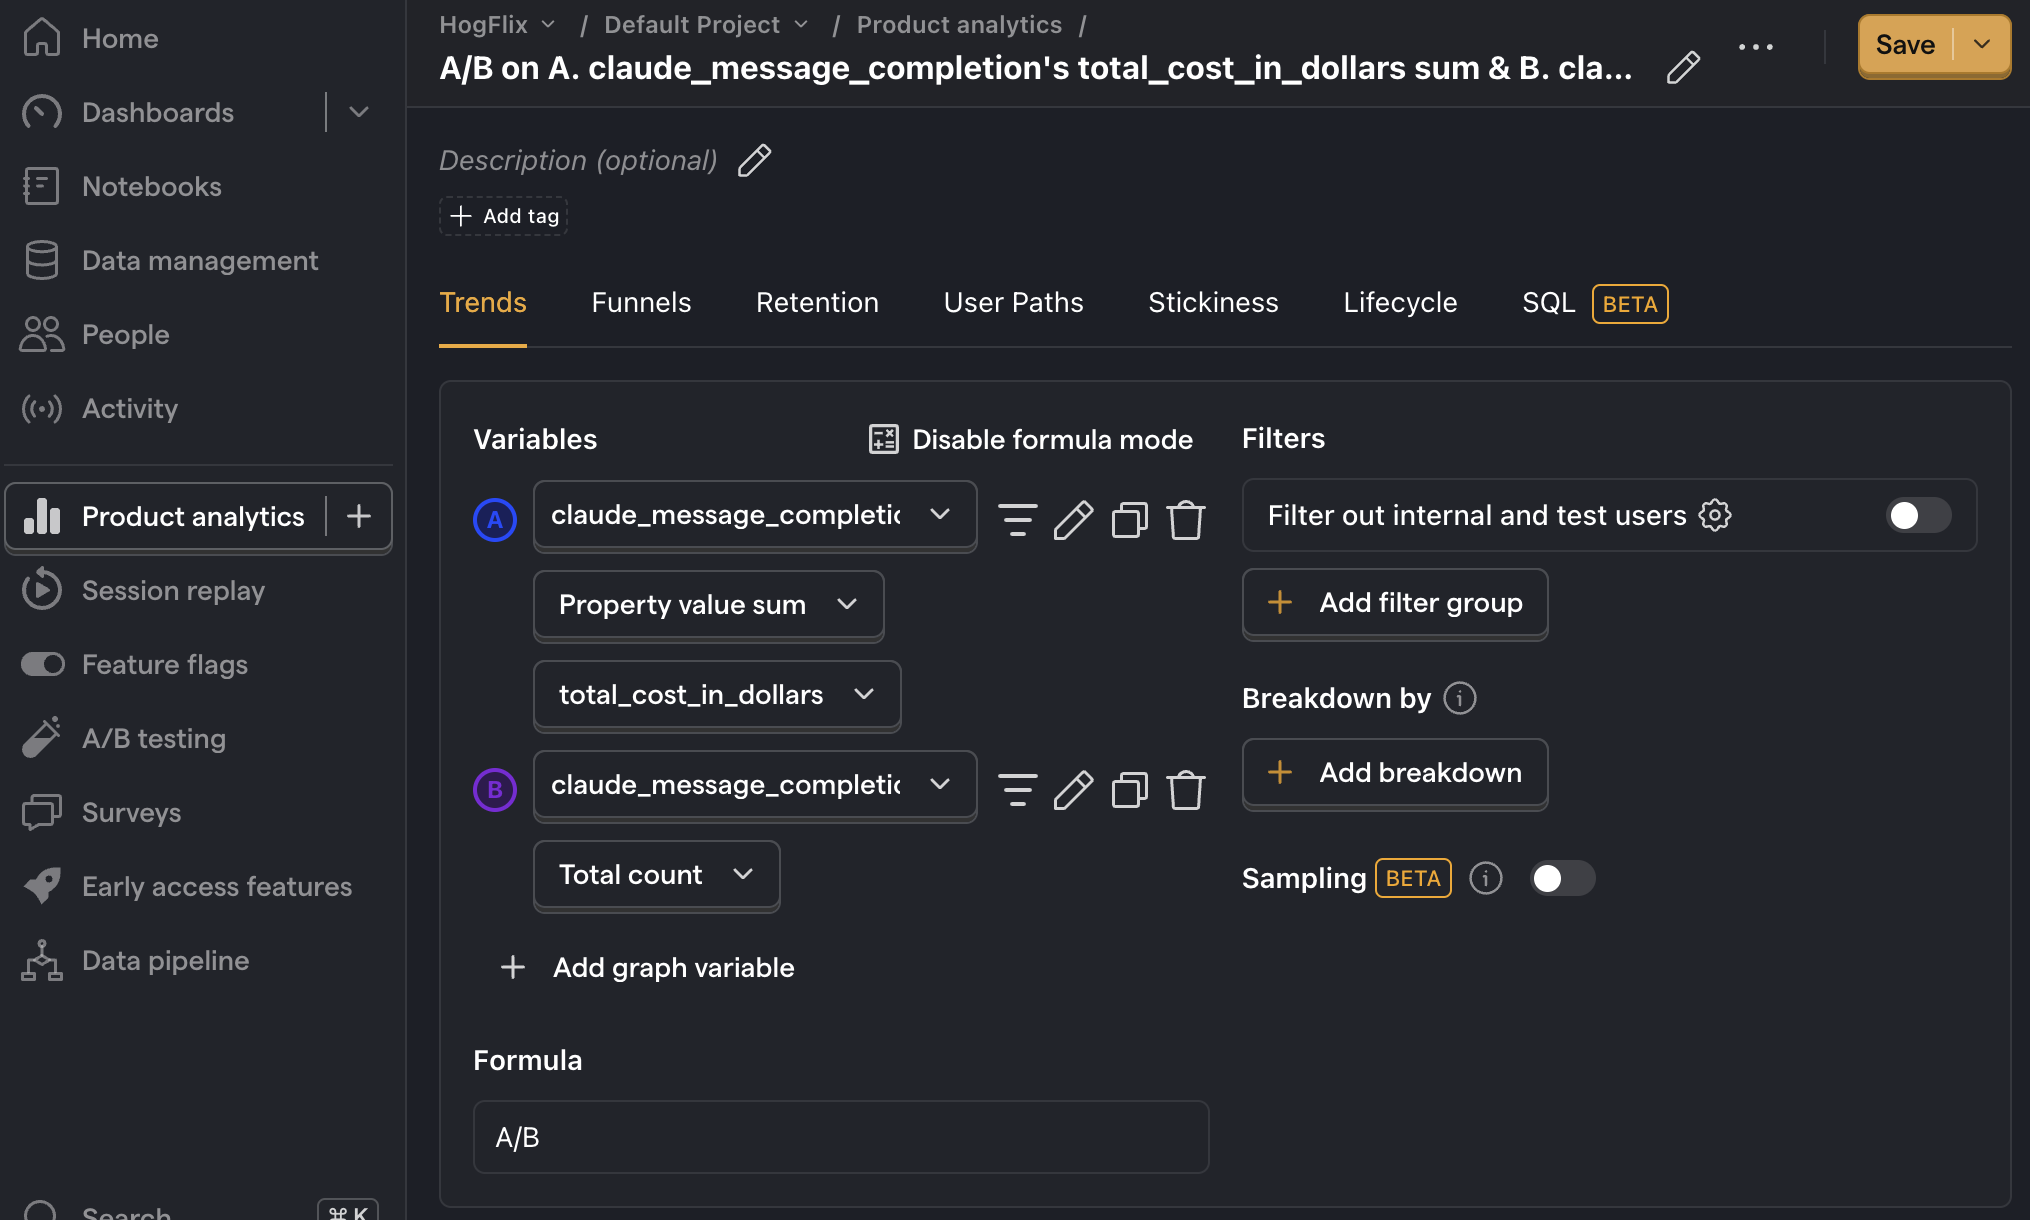
Average cost per user
This metric helps give you an idea of how your costs will scale as your product grows. Creating this insight is similar to creating the one above, however we use formula mode to divide the total cost by the total number of users:
- Set the event to
claude_message_completion - Click on Total count to show a dropdown. Click on Property value (sum).
- Select the
total_cost_in_dollarsproperty. - Click + Add graph series (if your visual is set to
number, switch it back totrendfirst). - Change the event name to
claude_message_completion. Then change the value from Total count to Unique users. - Click Enable formula mode.
- In the formula box, enter
A/B.
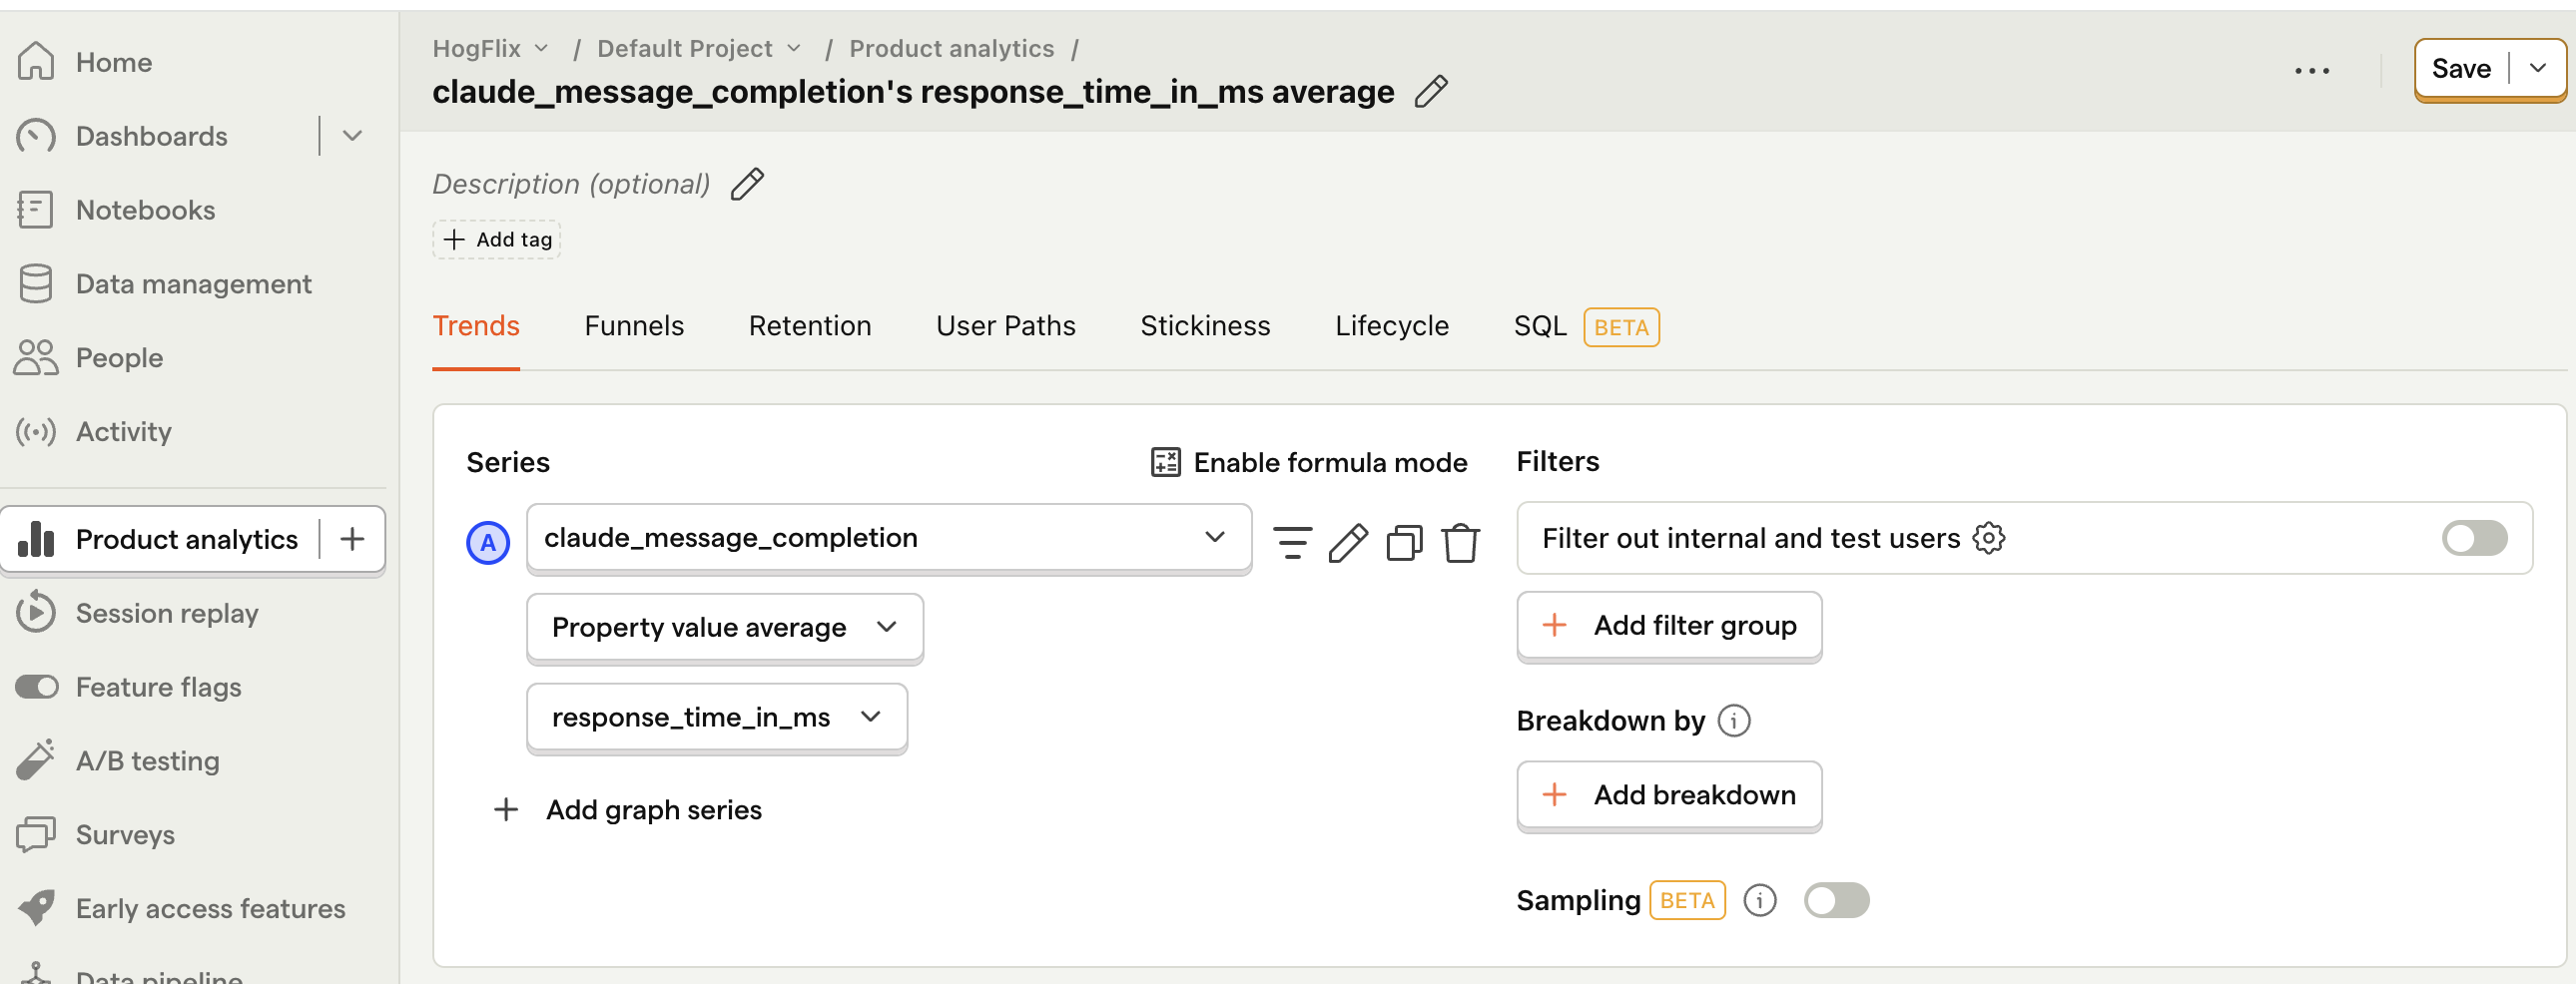
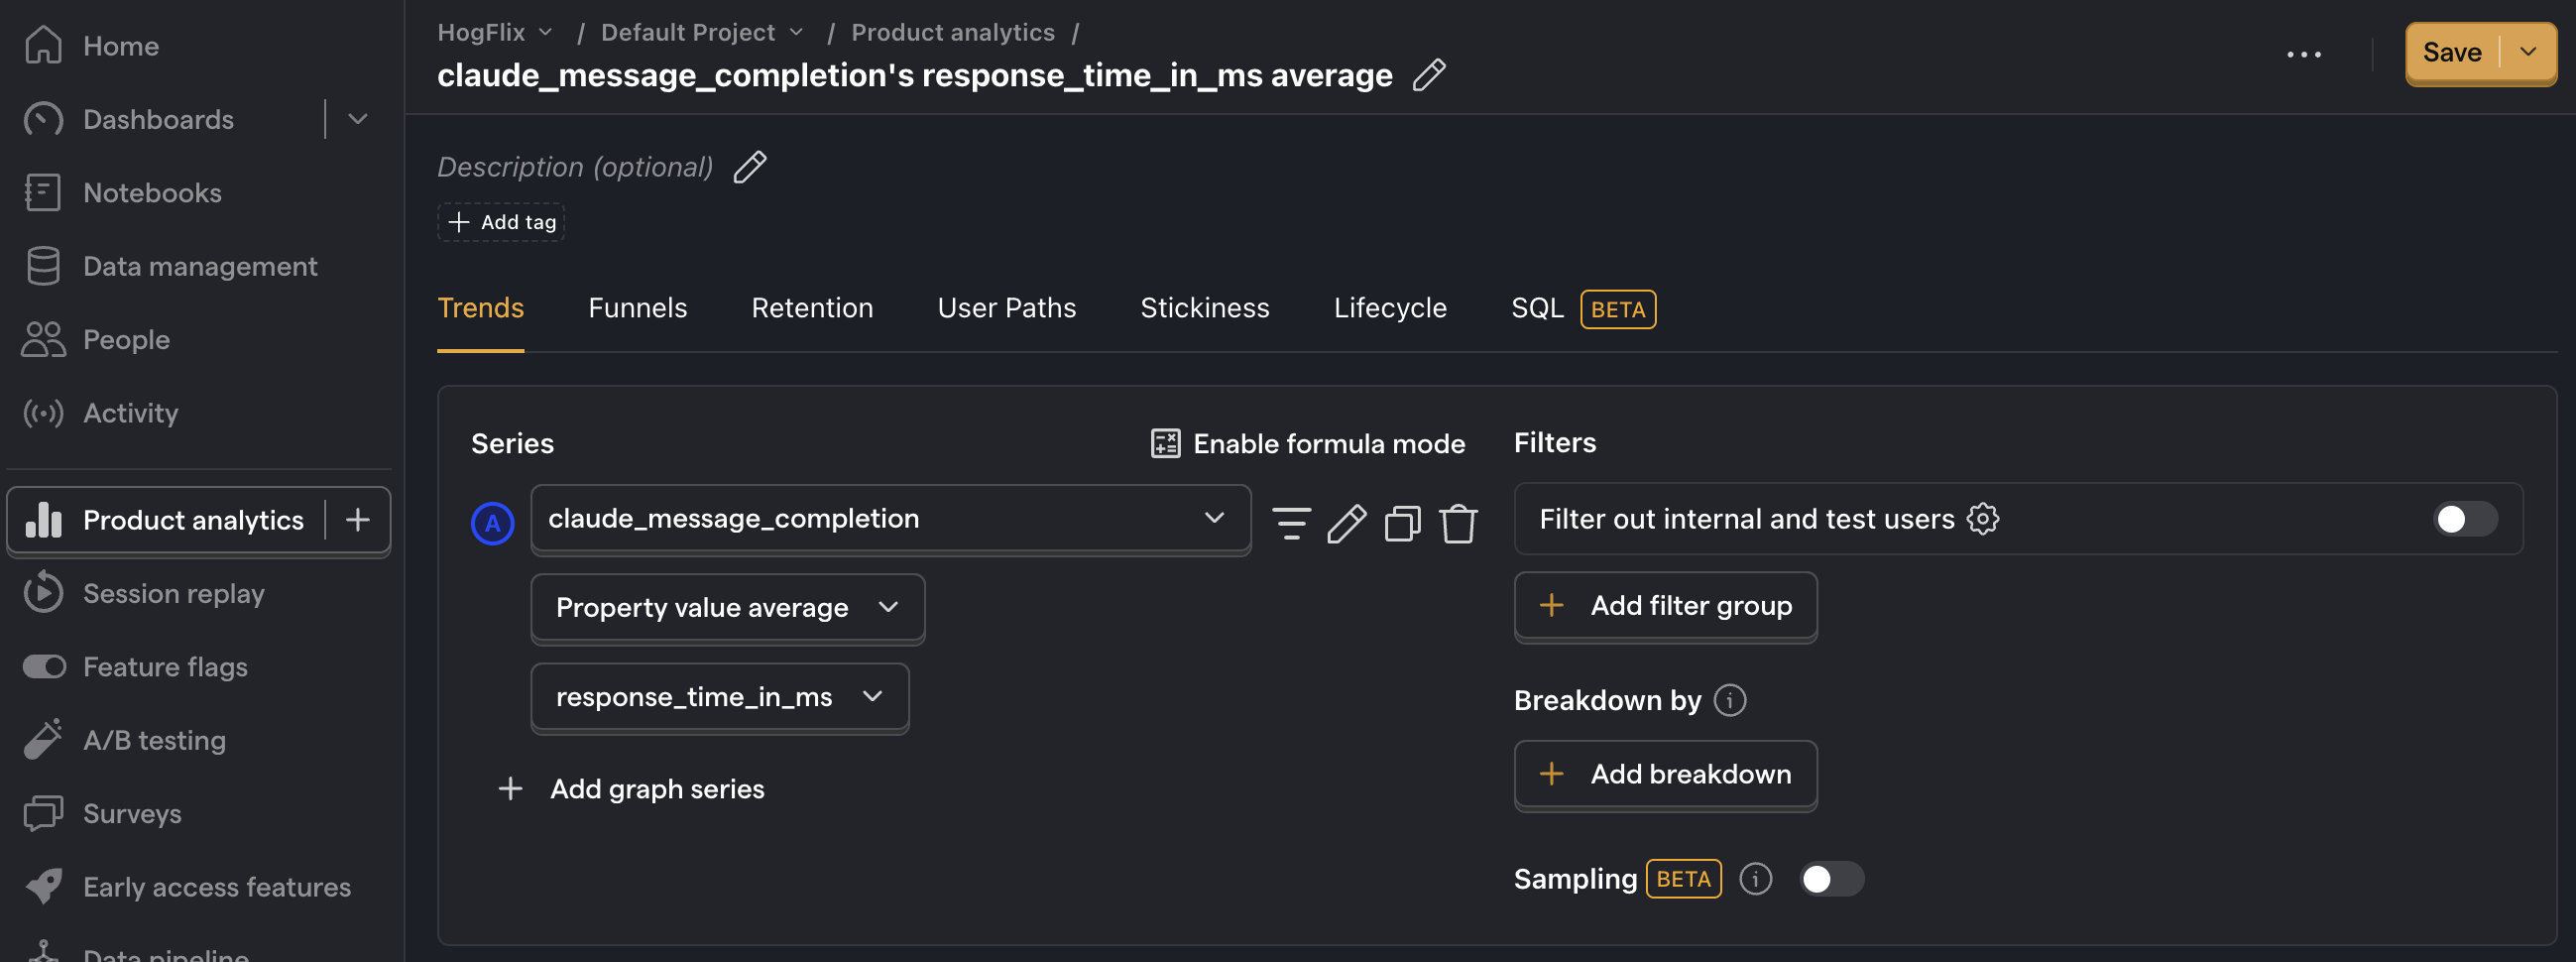
Average API response time
Anthropics's API response time can take long, especially for longer outputs, so it's useful to keep an eye on this. To do this, first we need to modify our event capturing to also include the response time:
Then, after capturing a few events, create a new insight to calculate the average response time:
- Set the event to
claude_message_completion - Click on Total count to show a dropdown. Click on Property value (average).
- Select the
response_time_in_msproperty.
Next steps
We've shown you the basics of creating insights from your product's Claude usage. Below are more examples of product questions you may want to investigate:
- How many of my users are interacting with my LLM features?
- Are there generation latency spikes?
- Does interacting with LLM features correlate with other metrics e.g. retention, usage, or revenue?
Further reading
- How to set up LLM analytics for Cohere
- How to set up LLM analytics for ChatGPT
- How to monitor LlamaIndex apps with Langfuse and PostHog

Subscribe to our newsletter
Product for Engineers
Read by 25,000+ founders and builders.
We'll share your email with Substack
Questions? Ask Max AI.
It's easier than reading through 552 docs articles.